上了 Coursera 的 Bayesian Methods for Machine Learning, 其中最後一週的課程介紹了 Gaussian processes & Bayesian optimization 覺得很有收穫, 因為做 ML 最痛苦的就是 hyper-parameter tuning, 常見的方法就是手動調, grid search or random search. 現在可以有一個較 “模型” 的作法: Bayesian optimization. 為了瞭解這個過程, 我們會介紹如下內容並同時使用 GPy and GPyOpt 做些 toy example:
- Random Process and Gaussian Process
- Stationary and Wide-Sense Stationary (WSS)
- GP for regression
- GP for bayesian optimization
讓我們進入 GP 的領域吧

Random Process (RP) and Gaussian Process (GP)
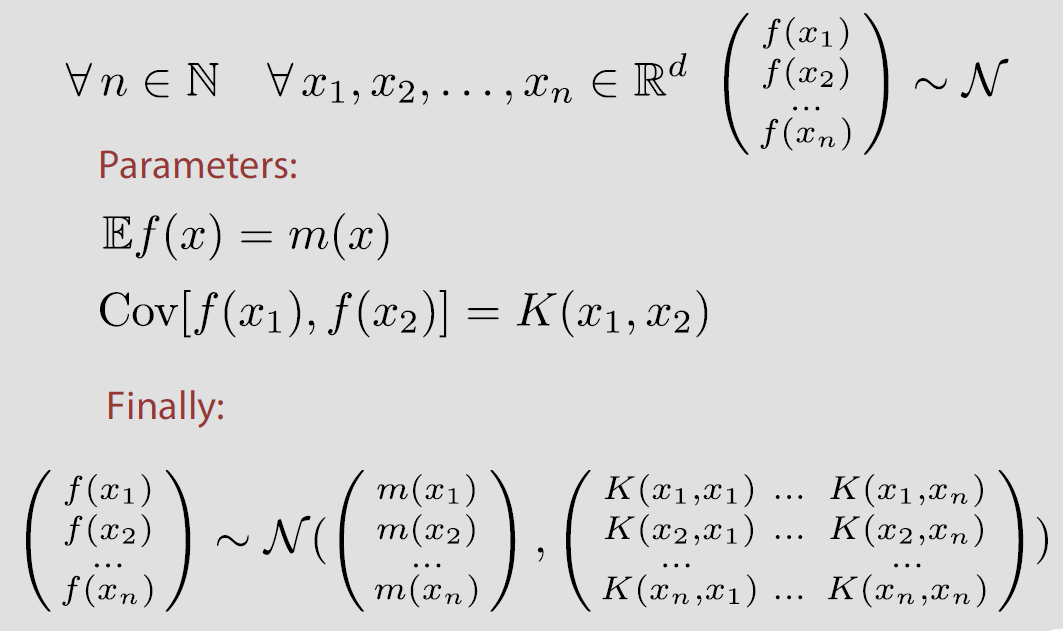
Random process (RP) 或稱 stochastic process 定義為
[Def]: For any $x\in\mathbb{R}^d$ assign random variable $f(x)$
例如 $d=1$ 且是離散的情形, ($x\in\mathbb{N}$) 定義說明對於每一個 $x$, $f[x]$ 都是一個 r.v. 所以 $f[1]$, $f[2]$, … 都是 r.v.s. 此 case 通常把 $x$ 當作時間 $t$ 來看.
而 Gaussian Process 定義為
[Def]: Random process $f$ is Gaussian, if for any finite number points, their joint distribution is normal.
Stationary and Wide-Sense Stationary (WSS)
Stationary
一個 RP 是 stationary 定義如下:
[Def]: Random process is stationary if its finite-dimensional distributions depend only on relative position of the points
簡單舉例: 取三個 r.v.s $(x_1,x_2,x_3)$ 他們的 joint pdf 會跟 $(x_1+t,x_2+t,x_3+t)$ 一模一樣
$$\begin{align}
p(f(x_1),f(x_2),f(x_3))=p(f(x_1+t),f(x_2+t),f(x_3+t))
\end{align}$$
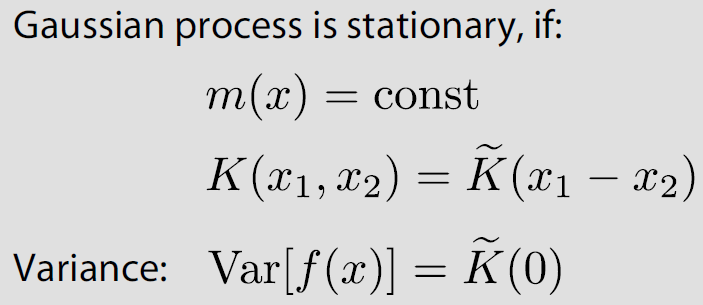
所以 pdf 只與相對位置有關, 白話講就是我們觀察 joint pdf 可以不用在意看的是哪個區段的信號, 因為都會一樣. 進一步地, 如果這個 RP 是 GP 的話, 我們知道 joint pdf 是 normal, 而 normal 只由 mean and variance totally 決定, 因此一個 GP 是 stationary 只要 mean and variance 只跟相對位置有關就會是 stationary. 基於這樣的條件我們可以寫出一個 stationary GP 的定義:
[Def]:
Covariance matrix or Kernel 只跟相對位置有關, 以下為三種常見的定義方式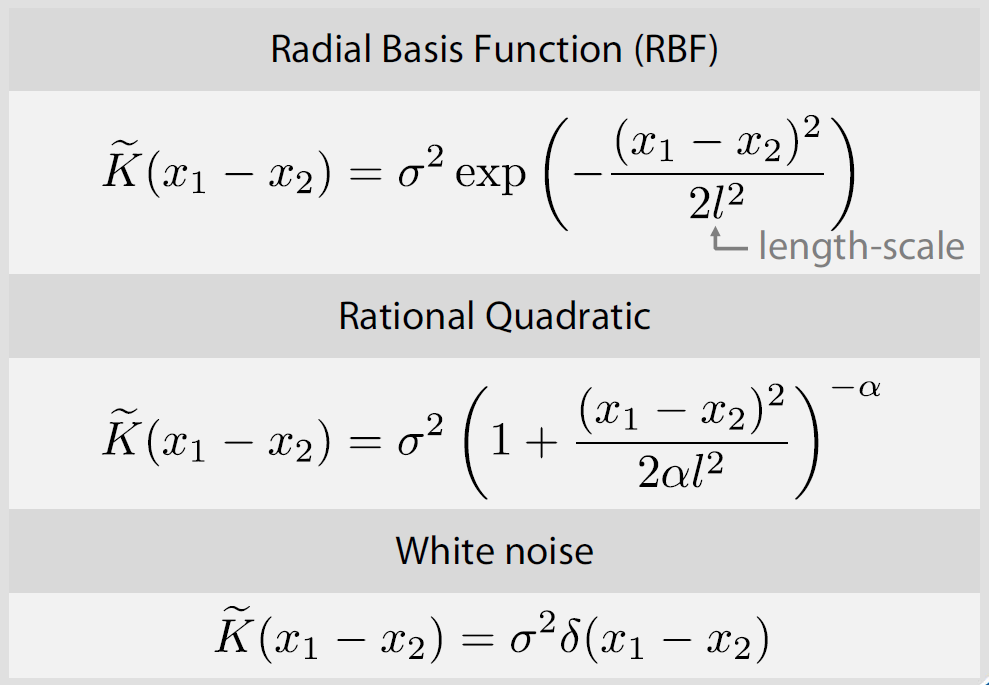
不管怎樣, 通常相對位置近的 r.v. 都會假設比較相關, (這也符合實際狀況, 譬如聲音訊號時間點相近的 sample 會較相關), 也因此 kernel 都會長類似下面的樣子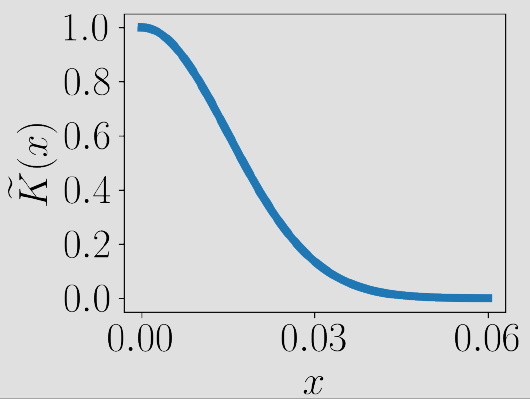
支線 Wide-Sense Stationary (WSS)
本段可跳過, 主要是為了更深地理解 stationary 做的補充.
WSS 定義為
[Def]: Random Process is WSS if its finite-dimensional distribution’s mean and variance depend only on relative position of the points
注意 WSS 與 Stationary 的定義差異. 準確來說 Stationary 要求所有的 moments 都只與相對位置有關, 但 WSS 只要求到 first and second order moments. 說明了 WSS 將 stationary 的條件放寬. 注意到 WSS 不一定是 stationary 的 GP, 這是因為 WSS 沒有要求 distribution 必須是 Normal.
WSS, Stationary GP, Stationary RP 之間的關係可以這麼描述:
$$\begin{align}
\mbox{Stationary GP}\subset\mbox{Stationary RP}\subset\mbox{WSS}
\end{align}$$
其實 WSS 與本篇主要討論的 Bayesian Optimization 沒有直接關係, 會想介紹是因為滿足 WSS 的話, 能使我們更直覺的 “看出” 一個訊號是否可能是 stationary. (另外 WSS 在 Adaptive Filtering 非常重要, 相當於基石的存在)
首先使用課程的 stationary 範例:

中間的圖明顯不是 stationary 因為 mean 隨著位置改變不是 constant, 但左邊和右邊就真的不是那麼容易看出來了. 那麼究竟有什麼方法輔助我們判斷 stationary 呢?
WSS 的 power-spectral density property 說明了一個 signal 如果是 WSS, 則它的 Covariance matrix or Kernel (訊號處理通常稱 auto-correlation) 的 DTFT 正好代表的物理意義就是 power spectral density, 而因為 kernel 不會因位置改變, 這導致了不管我們在哪個區段取出一個 window 的訊號, 它們的 power spectral density 都會長一樣. 這個性質可以讓我們很方便的 “看出” 是否是 stationary. (簡單講就是看 signal 的 frequency domain 是否因為隨著時間而變化, 變的話就一定不是 stationary)
好了, 接著回到主線去.
GP for regression
直接節錄課程 slides, 因為 stationary GP 的 mean 是 const, 因此我們扣掉 offset 讓其為 0, 之後再補回即可.
做 Regression 的目的就是 given $x$ 如何預測 $f(x)$, 而我們有的 training data 為 $x_1, …, x_n$ 以及它們相對的 $f(x_1),…,f(x_n)$. GP 就可以很漂亮地利用 conditional probability 預測 $f(x)$
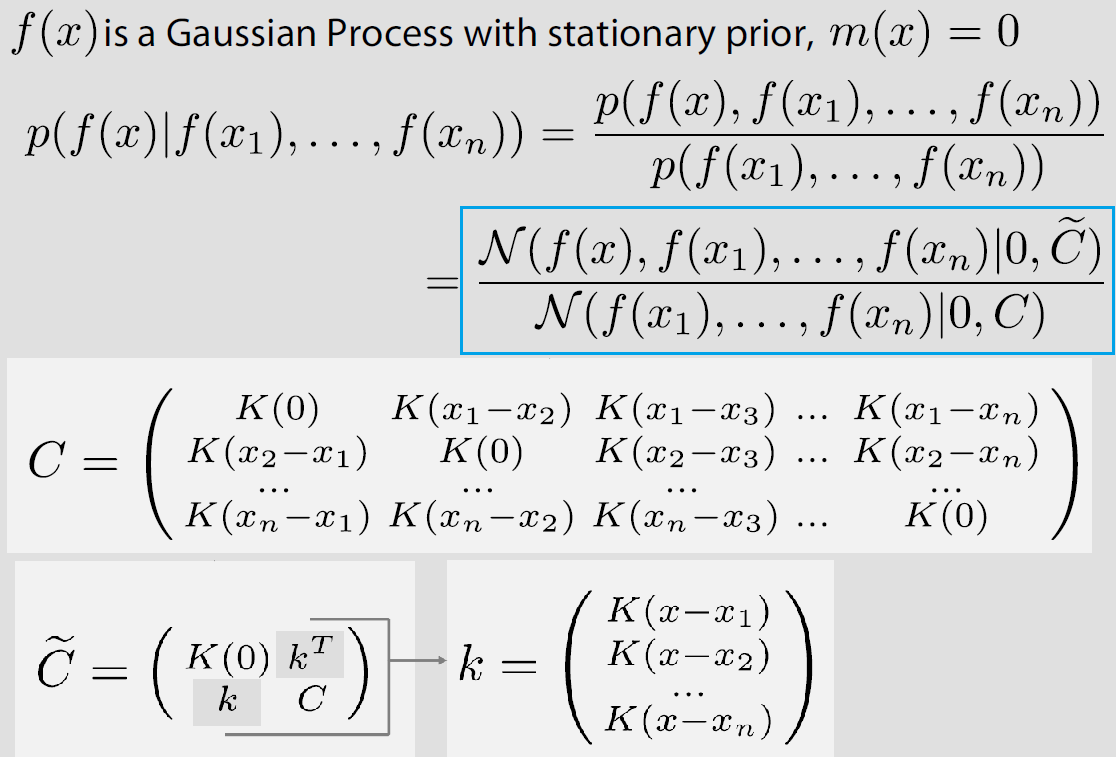
由於是 GP, 導致上面藍色部分結果仍是 Gaussian, 因此我們得到
Regression 公式: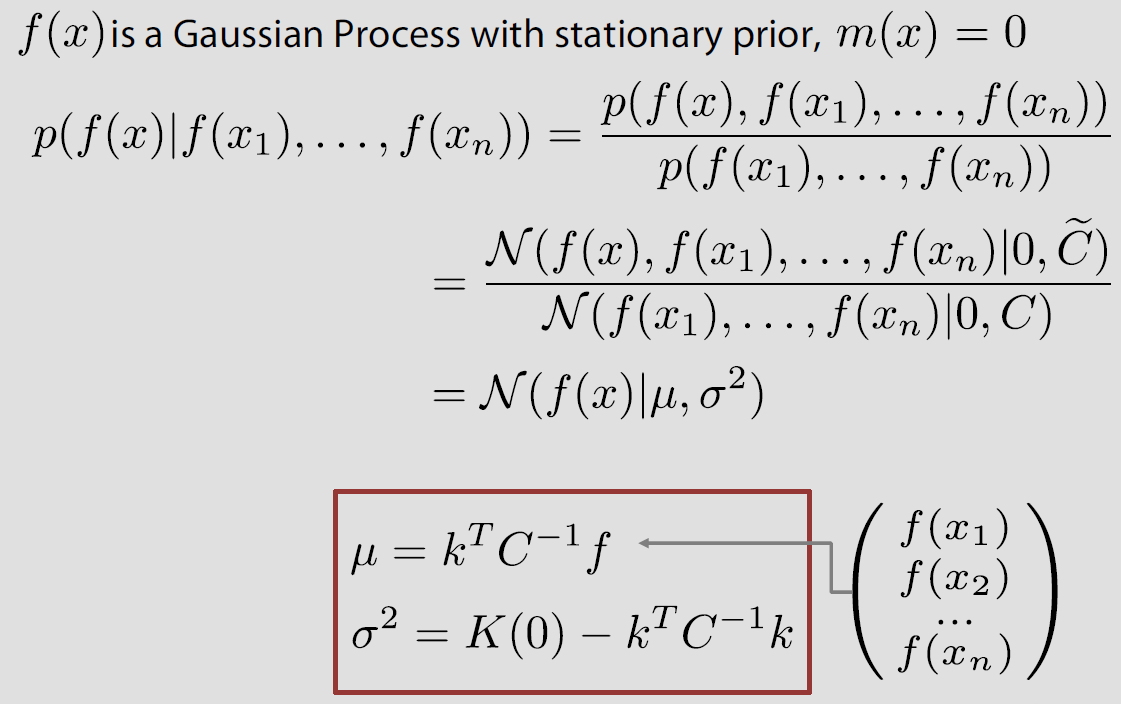
有時候我們的 observation $f(x)$ 是 noisy 的, 此時簡單地對 $f(x)$ 加上一個 random Gaussain noise 會使得我們的 model robust 些. 上面公式都不用改, 只要針對 kernel 作如下更動即可
GPy toolkit example
我們使用 Gaussian process regression tutorial 的範例, 使用上算是很直覺, 讓我們簡單實驗一下
|
|
Codes 的結果如下
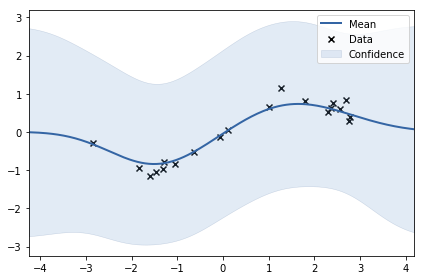
[Note]: 上圖的 Mean 和 Confidence 指的是 Regression 公式的 $\mu$ and $\sigma^2$ (前幾張有紅框的圖), 另外使用 GPy 算 regression 結果的話這麼使用
基本上 input 是一個
shape=(batch_size,in_dim)的 array
可以看到就算是 data point 附近, 所顯示的 y 還是有非常大的 uncertainty, 這是因為 observation noise 的 variance 可能太大了, 我們從 1.0 改成 0.04 (正確答案) 看看
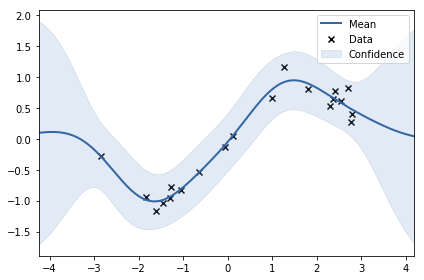
可以看到有 data point 的地方不確定性降低很多, 且不確定性看起來很合理 (當然, 因為我們用正確答案的 noise var)
接著我們改 kernel 的 lengthscale (控制平滑程度) 從 1 縮小成 0.5 應該可以預期 regression 的 mean 會扭曲比較大, 結果如下
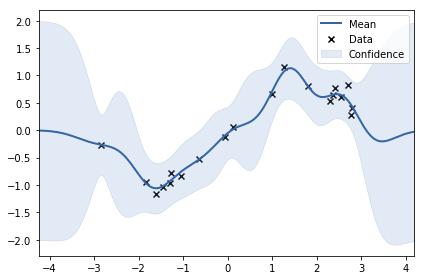
看看一個極端情況, 將 kernel 的 lengthscale 降到非常小, 這會導致 kernel 退化成 delta function, 也就是除了自己大家互不相關. 查看 regression 公式 (前幾張有紅框的圖), 由於 kernel 退化成 delta function, k 向量趨近於 0, 所以 regression 公式的 mean 趨近於 0, variance 趨近於 prior K(0). 我們將 lengthscale 調整成 0.02 得到如下的圖
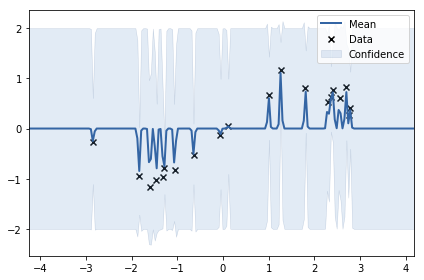
可以看到 x 稍微離開 data point 的地方, 基本 mean 就回到 0, 且 variance 回到 prior K(0)
從這簡單的實驗我們發現, 這三個控制參數:
-RBF variance
-RBF lengthscale
-GPRegression noise_var
設置不好, 基本很悲劇, 那怎麼才是對的? 下一段我們介紹使用最佳化方式找出最好的參數.
Learning the kernel parameters
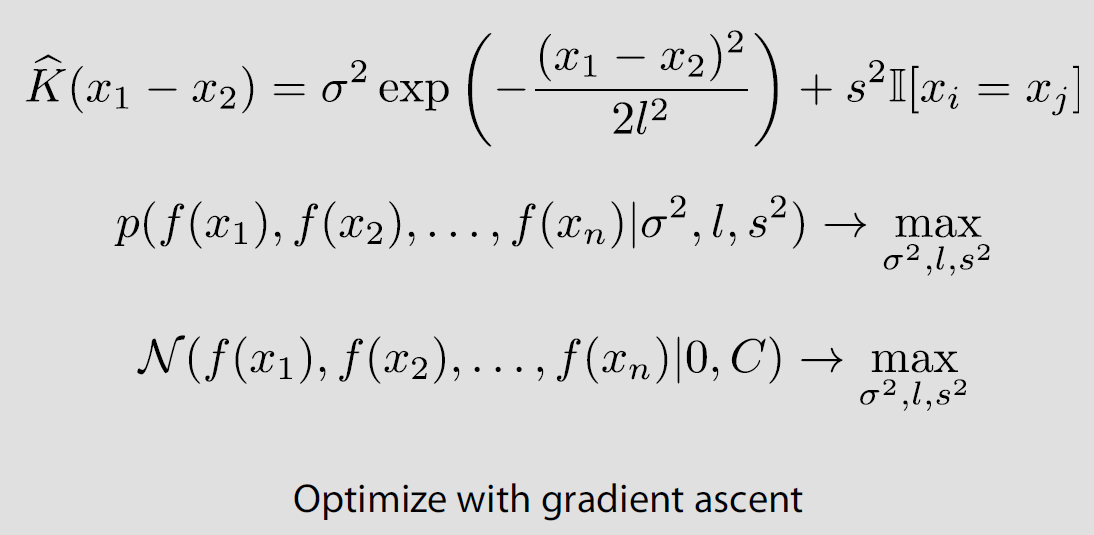
由於都是 normal, 因此 MLE 目標函式可微, 可微就使用 gradient ascent 來求參數. 課程 slide 如下
GPy 的使用就這麼一行 m.optimize(messages=True)
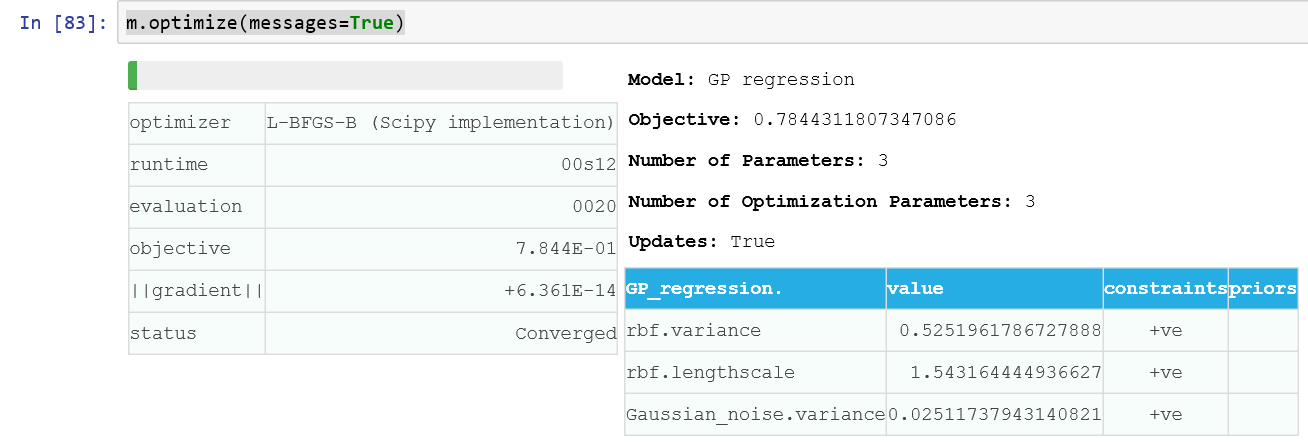
結果如下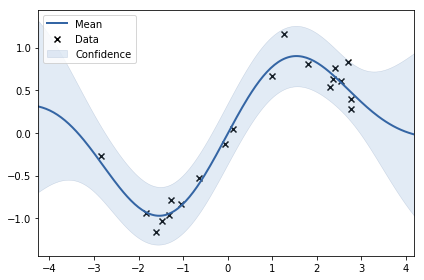
GP for bayesian optimization
問題再描述一下, 就是說模型有一大堆參數 (稱 $x$) 要調整, 選擇一組參數可以得到一個 validation accuracy (稱 $f(x)$), 我們希望找到一組參數使得 $f(x)$ 最大. 這個麻煩之處就在於我們對 $f(x)$ 的表示一無所知, 只能透過採樣得到 $f(x)$, 而每次要得到一個採樣的 $f(x)$ 都要經過漫長的訓練才能得到. 在這種情形下, 怎麼透過最少採樣點得到較大的 $f(x)$ 值呢?
大絕就是用 GP 來 approximate $f(x)$
合理嗎? 我們這麼想, 由於 kernel 一般的定義會使得相近的採樣點有較高的相關值, 也就是類似的參數會得到較相關的 validation accuracy. 這麼想的話多少有些合理. 另一個好處是使用 GP 可以帶給我們機率分布, 這使得我們可以使用各種考量來決定下一個採樣點. 例如: 我們可以考慮在那些不確定性較大的地方試試看, 因為說不定有更高的$f(x)$, 或是在已知目前估測的 GP model 下有較高的 mean 值那裏採樣. 這兩種方式稱為 “Exploration” and “Exploitation”
所以 Bayesian optimization 主要就兩個部分, Surrogate model (可以使用 GP) 和 Acquisition function:
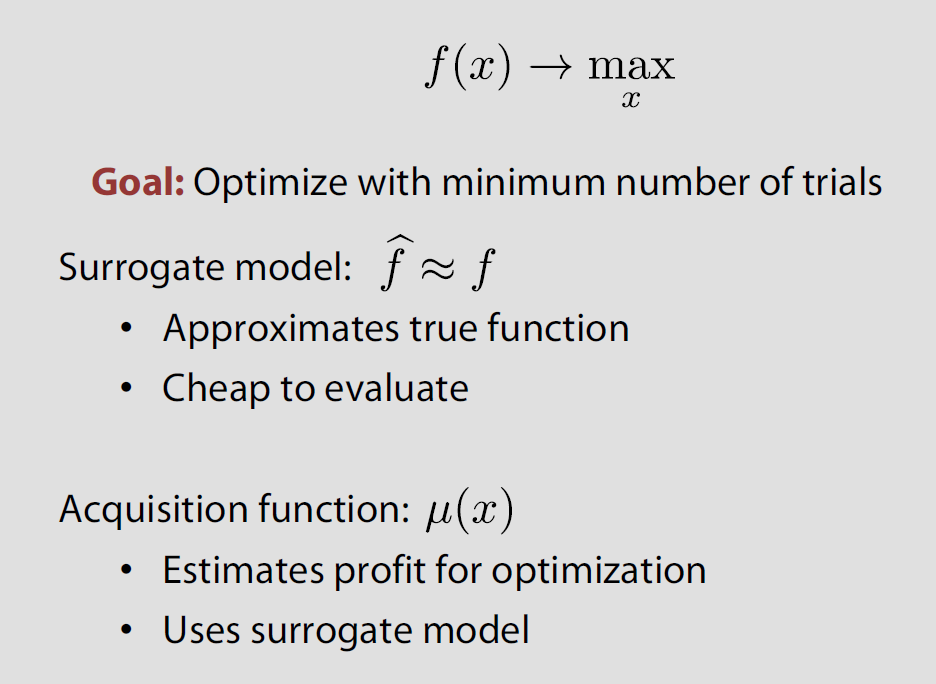
演算法就很直覺了, 根據 Acquisition function 得到的採樣點 $x$ 計算出來 $f(x)$ 後, 重新更新 GP (使用 MLE 找出最好的 GP 參數更新), 更新後繼續計算下個採樣點. 我們還未說明 Acquisition function 怎麼定義, 常用的方法有下面三種:
- Maximum probability of improvement (MPI)
- Upper confidence bound (UCB)
- Expected improvement (EI), 網路上說最常被用
Expected improvement (EI) 可以參考這篇 blog 搭配這個 implementation, 這裡就不重複了. 值得一提的是 Acquisition function 通常有個參數 $\xi$ 可以控制 Exploration 和 Exploitation 的 tradeoff. 接著我們使用 GPyOpt 練習一個 toy example.
GPyOpt toy example
類似上面的 GP for regression 的範例, $x$ and $f(x)$ 我們簡單定義如下:
|
|
這次我們將 $f(x)$ 故意加了一個 offset, 雖然對於 GP regression 的假設是 mean=0, 不過 GPyOpt 預設會對 $f(x)$ 去掉 offset, 所以其實我們可以很安全的使用 API. 接著關鍵程式碼如下
|
|
bounds 描述了每一個 probeY 的 arguments. 特別要說一下 exact_feval = False, 這是說明 $f(x)$ 是 noisy 的, 所以會有 noise variance 可以 model (參考 3. GP for regression 的 regression 公式含noise的情形), 這在實際情況非常重要. 更多 BayesianOptimization 參數描述 參考這
使用如下指令看 acquisition 和 regression function 的結果
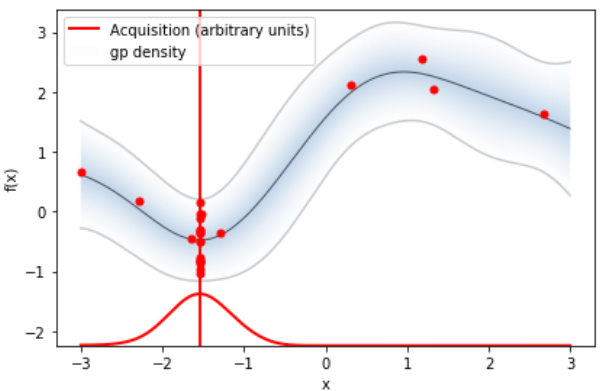
才花1x個採樣求出來的 regression function 就很逼近真實狀況了, 還不錯. 另外注意到這裡的 $f(x)$ 已經去掉 offset 了.
再來使用如下指令看每一次採樣值之間的差異, 以及採樣點的 $f(x)$
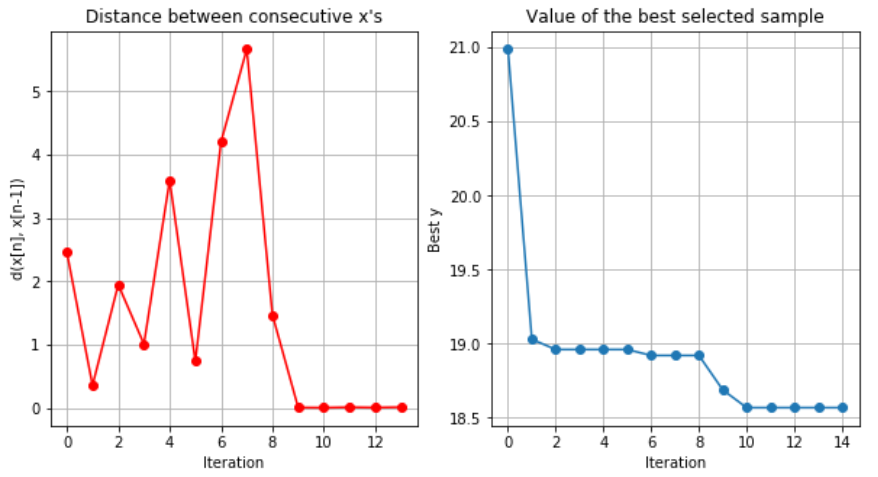
第9次採樣開始, 採樣點 $x$ 以及 $f(x)$ 之間基本沒什麼差異了.
若要拿到採樣過程的 $x$ and $f(x)$, 可使用 myBopt.X 和 myBopt.Y
XGBoost parameter tuning
針對 XGBoost 的參數進行最佳化 (可參考這篇 blog), 關鍵就在於上面的 $probeY$ 需替換成計算某個採樣的 evaluation accuracy (因此還需要訓練). 關鍵程式碼如下:
|
|
課程讓我們測試了 sklearn.datasets.load_diabetes() dataset, 使用 GPyOpt 可以讓 XGBoost 比預設參數有 9% 的提升! 還是很不錯的.
再來就很期待是否能真的在工作上對 DNN 套用了.
Reference
- GPy and GPyOpt
- GPyOpt’s documentation can find APIs
- GPyOpt tutorial
- 很好的 GPy and GPyOpt 數學和範例 blog
- Acquisition function implementation
- WSS power-spectral density property https://www.imft.fr/IMG/pdf/psdtheory.pdf
