import copy
from typing import Any, cast

import matplotlib.pyplot as plt
import torch
from matplotlib_inline.backend_inline import set_matplotlib_formats

from common.data import calibration_batches, trained_tiny_net
from common.models import example_inputs
from common.pt2e import (
    compare_results,
    convert_pt2e,
    export_module,
    extract_results_from_loggers,
    get_xnnpack_quantizer,
    prepare_for_propagation_comparison,
    prepare_pt2e,
    quiet,
)
from common.viz import table

quiet()
_ = torch.manual_seed(0)
set_matplotlib_formats("svg")
BLUE, ORANGE, MUTED = "#2a78d6", "#eb6834", "#52514e"M05-3 | 逐層診斷:量化誤差從哪一層開始變大

整體的輸出 SQNR 只告訴你「有問題」,不告訴你「在哪」。torchao 的 numeric debugger 把量化前後兩張圖逐 node 對齊,每個位置各給一個 SQNR。
- A. 用 numeric debugger 取得逐 node 的 SQNR。
- B. 怎麼讀:整體趨勢、為什麼不是逐層穩定下降、掉最多的位置。
- C. 參考圖要用哪一張。
A. 逐 node 的 SQNR
numeric debugger 的流程有三步,API 都從 common/pt2e.py 匯出:
prepare_for_propagation_comparison(圖):複製一份圖,在每個 node 後面接一個 logger,記下它的輸出。- 參考圖與量化圖各跑同一批輸入,
extract_results_from_loggers取出每個 logger 記到的值。 compare_results(參考, 量化):依 node 的來源資訊把兩邊對齊,每個位置算一個 SQNR。
參考圖用 prepare_pt2e 之後、校準之前的圖:BN 已經折掉,observer 還沒看過資料,只觀察、不改數值, 等於「折完 BN 的 fp32」,每個運算都和量化圖一一對應(C 段說明為什麼不能用 export 的原圖)。
舊版教學會在 export 後呼叫 generate_numeric_debug_handle(ep);torchao 0.18 的原始碼註解寫明它已不需要、只為了相容而保留,這裡不呼叫。
def build(model):
    """回傳 (參考圖, 量化圖):參考圖是 prepare 之後、校準之前的複本。"""
    prepared = prepare_pt2e(export_module(model, example_inputs()), get_xnnpack_quantizer(is_per_channel=True)[0])
    ref = copy.deepcopy(prepared)
    with torch.no_grad():
        for batch in calibration_batches(128):
            prepared(*batch)
    return ref, convert_pt2e(prepared)


def module_of(gm, node_name):
    """node 屬於哪個 module(看 nn_module_stack);observer 沒有 module,改看它量化的 node。"""
    node = next(n for n in gm.graph.nodes if n.name == node_name)
    if node.op == "call_module" and "activation_post_process" in node.target:
        node = node.args[0]
    stack = node.meta.get("nn_module_stack") or {}
    return (list(stack.values())[-1][0] if stack else "") or "(top)"


def layerwise_sqnr(ref_gm, quant_gm, x):
    """兩張圖跑同一批 x,回傳 [(module, SQNR), ...],依圖上的順序。"""
    labels = {n.name: module_of(ref_gm, n.name) for n in ref_gm.graph.nodes}  # 接 logger 之前先記下
    ref_l, quant_l = prepare_for_propagation_comparison(ref_gm), prepare_for_propagation_comparison(quant_gm)
    with torch.no_grad():
        ref_l(x)
        quant_l(x)
    # torchao 的型別標註和實際回傳值不符(extract 回傳 list[object]、compare 要 list[Tensor]),所以略過型別檢查
    summaries = compare_results(
        extract_results_from_loggers(ref_l),  # pyright: ignore[reportArgumentType]
        extract_results_from_loggers(quant_l),  # pyright: ignore[reportArgumentType]
    )
    return [(labels[s.ref_node_name], float(cast(Any, s.results[0].sqnr))) for s in summaries.values()]


model = trained_tiny_net()
(x,) = next(calibration_batches(64, seed=9))
ref, quant = build(model)
result = layerwise_sqnr(ref, quant, x)
names, scores = [m for m, _ in result], [s for _, s in result]
drops = [scores[i] - scores[i - 1] for i in range(1, len(scores))]
worst = 1 + min(range(len(drops)), key=lambda i: drops[i])  # 比前一個位置掉最多的位置
畫圖的程式
fig, ax = plt.subplots(figsize=(7.2, 3.4))
ax.plot(range(len(scores)), scores, color=BLUE, lw=2, marker="o", ms=5)
ax.scatter([worst], [scores[worst]], s=90, facecolors="none", edgecolors=ORANGE, linewidths=2, zorder=3)
ax.annotate(f"largest drop: {drops[worst - 1]:+.1f} dB", (worst, scores[worst]), xytext=(0, -22),
            textcoords="offset points", ha="center", color=MUTED, fontsize=9)
ax.set_xticks(range(len(scores)), [f"{i} {n}" for i, n in enumerate(names)], rotation=45, ha="right", fontsize=8)
ax.set_ylabel("SQNR vs folded fp32 (dB)", color=MUTED)
ax.grid(axis="y", color="#e6e5e1", lw=0.8)
ax.spines[["top", "right"]].set_visible(False)
ax.tick_params(colors=MUTED)
plt.show()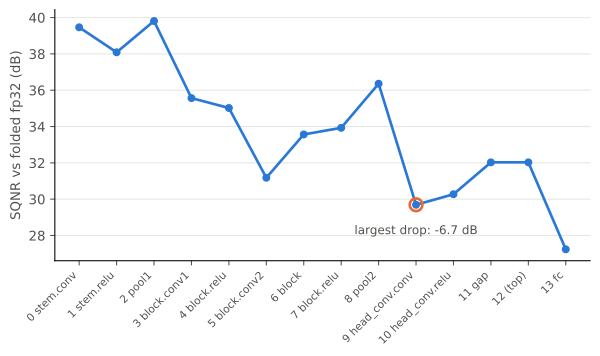
table([[i, m, f"{s:.1f}", "—" if i == 0 else f"{s - scores[i - 1]:+.1f}"] for i, (m, s) in enumerate(result)],
["#", "module", "SQNR (dB)", "比前一個位置"])| # | module | SQNR (dB) | 比前一個位置 |
|---|---|---|---|
| 0 | stem.conv | 39.5 | — |
| 1 | stem.relu | 38.1 | -1.4 |
| 2 | pool1 | 39.8 | +1.7 |
| 3 | block.conv1 | 35.6 | -4.2 |
| 4 | block.relu | 35.0 | -0.5 |
| 5 | block.conv2 | 31.2 | -3.8 |
| 6 | block | 33.6 | +2.4 |
| 7 | block.relu | 33.9 | +0.4 |
| 8 | pool2 | 36.4 | +2.4 |
| 9 | head_conv.conv | 29.7 | -6.7 |
| 10 | head_conv.relu | 30.3 | +0.6 |
| 11 | gap | 32.0 | +1.8 |
| 12 | (top) | 32.0 | +0.0 |
| 13 | fc | 27.2 | -4.8 |
每個位置的數字,是「量化圖在這個 node 的輸出」對「參考圖在同一個 node 的輸出」的 SQNR。 同一批輸入從頭跑到這裡,所以它累積了前面所有層的誤差。(top) 是不屬於任何子模組的 node(flatten)。
B. 怎麼讀
ups = sum(d > 0 for d in drops)
print(f"整體:從 {scores[0]:.1f} dB 降到 {scores[-1]:.1f} dB;{len(drops)} 步裡有 {ups} 步回升")
print(f"比前一個位置掉最多:第 {worst} 個位置({names[worst]},{drops[worst - 1]:+.1f} dB)")
assert scores[-1] < scores[0] and ups > 0
整體:從 39.5 dB 降到 27.2 dB;13 步裡有 6 步回升
比前一個位置掉最多:第 9 個位置(head_conv.conv,-6.7 dB)- 趨勢是往後走低:越靠近輸出,累積的量化誤差越多。累積的直接證據在 M05-4 D 段:只量化前 k 個 module,k 越大整體 SQNR 越低。
- 但不是逐層穩定下降:有好幾步是回升的。每個位置的訊號大小與分布不同,誤差相對於訊號的比例(SQNR)不一定單調。這是推論,這裡沒有逐項拆解。
- 每一步的下降量混合了兩件事:這一層自己的量化誤差,以及前面傳下來的誤差(可能被這層放大,推論)。 掉最多的位置是一條線索,但 M05-4 會看到:把它留在 fp32 不一定最有用,真正影響整體 SQNR 最大的是最後的
fc。
所以逐層 SQNR 用來縮小範圍:先看整體 SQNR 判斷有沒有問題,再用逐層 SQNR 找候選,最後用實驗確認(M05-4)。
C. 參考圖要用哪一張
直覺上會拿 export 的原圖當參考。試試看:
gm = export_module(model, example_inputs())
from_export = layerwise_sqnr(gm, copy.deepcopy(quant), x)
print(f"參考圖 = prepare 之後的圖:對上 {len(result)} 個位置")
print(f"參考圖 = export 的原圖:  對上 {len(from_export)} 個位置")
assert len(result) > 0 and len(from_export) == 0
參考圖 = prepare 之後的圖:對上 14 個位置
參考圖 = export 的原圖: 對上 0 個位置在 torchao 0.18 上,export 的原圖一個位置都對不上,compare_results 回傳空的結果,不會報錯。 推論(這裡沒有追原始碼的對齊細節):對齊依據的是 prepare_pt2e 處理過的 node 來源資訊,沒經過 prepare 的圖沒有對應的資訊。
就算對得上,export 的原圖還有沒折的 BN,conv 的輸出和量化圖本來就不是同一個運算,比出來的低 SQNR 是假警報。 「prepare 之後、校準之前」的圖兩個問題都沒有:運算和量化圖相同,差別只有量化。
小結
- numeric debugger 給每個位置一個 SQNR,累積了前面所有層的誤差;整體往後走低,但不單調。
- 掉最多的位置是線索,不是結論,要用實驗確認(M05-4)。
- 參考圖用「prepare 之後、校準之前」的複本;export 的原圖對不上任何位置。