M08-4 | Is It Really Faster: eager, Q/DQ Graph, fp32 .pte, int8 .pte
Open In Colab
M07 has no int8 kernel, so it does not measure speed; XNNPACK does. With the same model, compare four ways of running:
Way of running
Where it comes from
What runs
eager fp32
the original model
PyTorch eager, every op goes through Python and the dispatcher
Q/DQ graph
the result of convert_pt2e
PyTorch eager: fp32 computation, plus q/dq
fp32 .pte
the original model lowered directly without quantizing
ExecuTorch + XNNPACK fp32 kernels
int8 .pte
the Q/DQ graph lowered again (M08-2)
ExecuTorch + XNNPACK int8 kernels
Predict first: will the Q/DQ graph be faster than eager? Which one should the int8 .pte’s speedup be compared against?
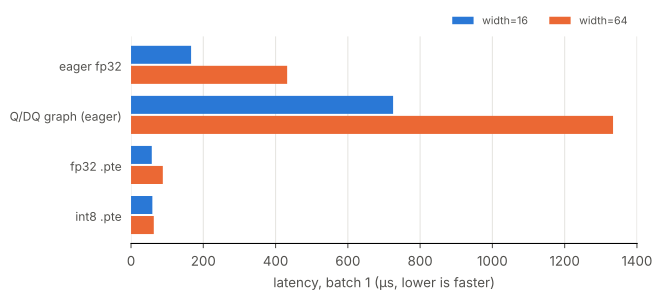
A. TinyConvNet at two widths, latency at batch 1.
B. Split the gain into two parts: switching runtime, then quantizing.
The numbers depend heavily on the machine (CPU, thread count, XNNPACK version); look only at the relative relationships. The outputs stored below come from the environment printed at the start, and the commentary is generated from the measurements. This notebook needs executorch (uv sync --group executorch).
import timeitimport matplotlib.pyplot as pltimport torchfrom matplotlib_inline.backend_inline import set_matplotlib_formatsfrom common.pt2e import quiet # must be imported before executorchfrom common.env import env_summaryfrom common.executorch_utils import PteRunner, lower_to_xnnpack, xnnpack_ptqfrom common.models import TinyConvNet, example_inputsfrom common.viz import tablequiet()_ = torch.manual_seed(0)set_matplotlib_formats("svg")print(env_summary())
width is the channel count of TinyConvNet’s middle conv layers (head_conv is 2×width). The two widths have the same input size and batch; they differ only in the computation per layer.
Timing method: each variant is warmed up 20 times, then run for 7 rounds of 100 calls each, and the average of the fastest round is taken (least disturbed by background processes). Latency does not depend on the weight values, so an untrained model and a small amount of calibration are enough.
@torch.no_grad()def latency_us(fn, x, warmup=20, number=100, repeat=7):for _ inrange(warmup): fn(x)returnmin(timeit.repeat(lambda: fn(x), number=number, repeat=repeat)) / number *1e6def measure(width):"""Return (parameter count, {way of running: microseconds}).""" torch.manual_seed(0) model = TinyConvNet(width=width).eval() x = example_inputs(1) qdq = xnnpack_ptq(model, x, n_calib=32) runners = {"eager fp32": model,"Q/DQ graph": qdq,"fp32 .pte": PteRunner(lower_to_xnnpack(model, x)[1]),"int8 .pte": PteRunner(lower_to_xnnpack(qdq, x)[1]), } n_params =sum(p.numel() for p in model.parameters())return n_params, {name: latency_us(fn, x[0]) for name, fn in runners.items()}WIDTHS = [16, 64]results = {w: measure(w) for w in WIDTHS}METHODS =list(results[WIDTHS[0]][1])table([[f"width={w} ({n} parameters)"] + [f"{t[m]:.1f}"for m in METHODS] for w, (n, t) in results.items()], ["microseconds (lower is faster)"] + METHODS)
microseconds (lower is faster)
eager fp32
Q/DQ graph
fp32 .pte
int8 .pte
width=16 (9940 parameters)
166.2
725.2
57.4
59.0
width=64 (150340 parameters)
432.1
1333.9
88.0
63.0
Plotting code
LABELS = {"eager fp32": "eager fp32", "Q/DQ graph": "Q/DQ graph (eager)", "fp32 .pte": "fp32 .pte", "int8 .pte": "int8 .pte"}COLORS = {16: "#2a78d6", 64: "#eb6834"}MUTED, GRID ="#52514e", "#e6e5e1"fig, ax = plt.subplots(figsize=(6.8, 2.8))h =0.36for j, w inenumerate(WIDTHS): t = results[w][1] ys = [i + (j -0.5) * (h +0.04) for i inrange(len(METHODS))] ax.barh(ys, [t[m] for m in METHODS], height=h, color=COLORS[w], label=f"width={w}")ax.set_yticks(range(len(METHODS)), [LABELS[m] for m in METHODS], fontsize=9)ax.invert_yaxis()ax.set_xlabel("latency, batch 1 (µs, lower is faster)", color=MUTED)ax.grid(axis="x", color=GRID, lw=0.8)ax.set_axisbelow(True)ax.spines[["top", "right", "left"]].set_visible(False)ax.tick_params(colors=MUTED, left=False)ax.legend(loc="lower right", bbox_to_anchor=(1, 1), ncol=2, frameon=False, labelcolor=MUTED, fontsize=8)plt.show()
B. The Gain Splits into Two Parts: Switching Runtime, Then Quantizing
Work out the factor for each part, with the Q/DQ graph against eager as a reference:
def speedup(before_us, after_us):"""Going from before to after: print "N× faster" if after is faster, "N× slower" if slower.""" ratio = before_us / after_usreturnf"{ratio:.2f}× faster"if ratio >=1elsef"{1/ ratio:.2f}× slower"table([[f"width={w}", speedup(t["eager fp32"], t["fp32 .pte"]), speedup(t["fp32 .pte"], t["int8 .pte"]), speedup(t["eager fp32"], t["Q/DQ graph"])] for w, (_, t) in results.items()], ["", "switch runtime (eager → fp32 .pte)", "quantize (fp32 .pte → int8 .pte)", "reference (eager → Q/DQ graph)"])
switch runtime (eager → fp32 .pte)
quantize (fp32 .pte → int8 .pte)
reference (eager → Q/DQ graph)
width=16
2.90× faster
1.03× slower
4.36× slower
width=64
4.91× faster
1.40× faster
3.09× slower
small, large = (results[w][1] for w in WIDTHS)n_small, n_large = (results[w][0] for w in WIDTHS)ifall(t["Q/DQ graph"] > t["eager fp32"] for _, t in results.values()):print("* The Q/DQ graph is slower than eager: it is still fp32 computation, just with extra q/dq.")ifall(t["fp32 .pte"] < t["eager fp32"] for _, t in results.values()):print("* The unquantized fp32 .pte is already much faster than eager: the whole graph is handed to XNNPACK at once, saving the overhead of every op going through Python and the dispatcher.")print(f" The parameter count grows {n_large / n_small:.0f}×, yet eager is only {large['eager fp32'] / small['eager fp32']:.1f}× slower: ""most of eager's time goes to call overhead, not computation (inference).")gain_small, gain_large = (t["fp32 .pte"] / t["int8 .pte"] for t in (small, large))if gain_small >1and gain_large > gain_small:print(f"* int8 speedup over the fp32 .pte: {gain_small:.2f}× at width 16, {gain_large:.2f}× at width 64; the more computation, the more visible.")print(" When the model is too small, fixed overhead (the call, fp32 ↔ int8 conversion at input and output) takes a large share (inference; only two widths were measured).")elif gain_small >1or gain_large >1:print(f"* int8 .pte speedup over fp32 .pte: {gain_small:.2f}× / {gain_large:.2f}×, not growing with width.")else:print("* On this machine, the int8 .pte is not faster than the fp32 .pte: whether XNNPACK's int8 kernels are fast depends on the CPU's instruction set.")
* The Q/DQ graph is slower than eager: it is still fp32 computation, just with extra q/dq.
* The unquantized fp32 .pte is already much faster than eager: the whole graph is handed to XNNPACK at once, saving the overhead of every op going through Python and the dispatcher.
  The parameter count grows 15×, yet eager is only 2.6× slower: most of eager's time goes to call overhead, not computation (inference).
* int8 .pte speedup over fp32 .pte: 0.97× / 1.40×, not growing with width.
“Faster after deployment” has to be looked at in two parts: the gain from switching runtime and the gain from quantizing are two separate things. So when comparing int8, the baseline is the fp32 on the same runtime (the fp32 .pte), not PyTorch eager (M07 overview, “The Baseline for Speed”).
Summary
Quantization by itself does not make things faster; the Q/DQ graph is actually slower in eager. A backend has to swap it for int8 kernels.
Switching to ExecuTorch + XNNPACK already makes fp32 much faster; the gain from int8 must be measured against the fp32 .pte.
The model here is tiny, and part of what is measured is call overhead; measure the real gain with your own model on the target device.